Inflation developments
I deeply doubt the extent to which core inflation indicates the core inflation.
A month ago, the consumer price increase was announced to be -1.43. This way, inflation, which had been at 7.2 percent in May, went down to 6.2 percent in June. That is the lowest inflation rate in June since 2003. In the period between 2006-2010 inflation rates in June averaged -0.14 percent. The same value for 2007-2010 was -0.26 percent.
It is possible to see the drop in June as an improvement. As you will remember, May inflation was very high due to an unexpected increase in wet fruit and vegetable prices in the previous month. I do not agree with the idea of improvement.
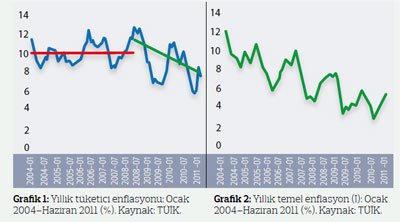
Graph 1 shows yearly consumer inflation activity for January 2004 - June 2010. One glance will reveal a break in mid-2008. From the beginning of 2004 to April 2008, at which time inflation was at a record-breaking 12.1, inflation was still in inertia. It hovered at around an average of 8.9 without going up or down. Inflation was at 8.9 percent from January 2004 to April 2008 and down to 7.7 percent between May 2008 and June 2011. But that is not what I mean by "a break."
The second term does not display the same inertia as the first; there is a decrease in inflation. I show the 8.9 percent average as well as the downward trend in the graph below. I should not say that this is a fairly rough trend: I graphed the June 2011 trend according to the Central Bank's end of the year estimate of 6.5 percent.
Now to the core inflation indicator (indicator I), which the Central Bank highly values. Yearly inflation has been increasing steadily since October 2010. This is not good. But we should keep in mind that cyclical movements are always observed in this indicator. There is a steady decrease for a certain time, and a steady climb in another. In the previous term, annual core inflation went down from the end of 2008 until mid-2009, then increased until April 2010. In this cycle it went down from April 2010 until October 2010. It has been trending upward ever since (graph 2).
As previously noted, I seriously doubt the extent to which core inflation indicates core inflation. But these doubts aside, the important thing is this: the main trend in core inflation has been downwards since 2004. Some more numbers: The average core inflation in the months of June between 2006-2010 were 0.7 percent, and 0.54 percent between 2007-2010. This June was somewhere between these values: 0.63 percent.
The important questions are these: Will the said positive break in consumer inflation be permanent? Or will we say, for example, in a year, that there isn't a break after all? A similar question is also valid for underlying inflation: Will this last upward trend, like previous ones, be temporary and not change the general downward trend?
On Thursday, I will discuss the implications of possible answers these questions may have for monetary politics.

This commentary was published in Radikal daily on 05.07.2011


