The economy recovers, but...
On Monday a critical data was announced. Industrial production increased by 7.5 percent compared to the same period in the last year when elements like seasonal factors and the differences between the labor force size are ignored. This is a significant surge. Another important development is that by the first months of the 2009, industrial production enjoyed a rise.
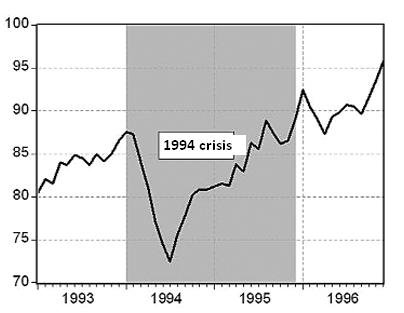
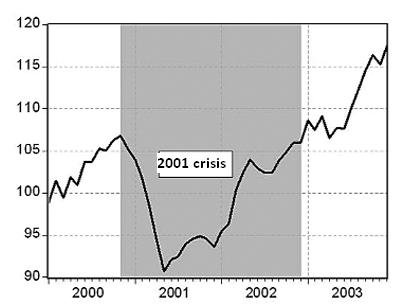
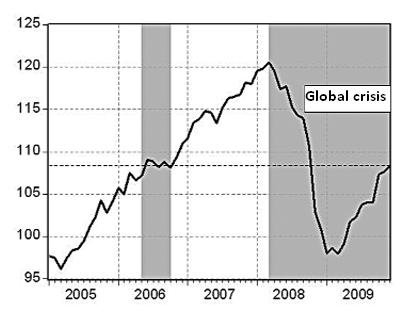
It would be useful to compare the changes in the industrial production with the situation during the two major crisis Turkey's economy encountered. Graphs below show the changes in industrial production during the 1994 and 2001 crisis, respectively. The data were retrieved from the index TURKSTAT announced back then and they are also net of seasonal movements and the changes in the size of the labor force. The last graph shows the changes in industrial production during the global crisis on the basis of the latest industrial production series of the TURKSTAT.
The highlighted area in the first two graphs indicates the period between the time industrial production peaked before the crisis and the time industrial production first reached that peak level after the crisis. In1994 crisis it took twenty three months for industrial production to achieve that peak level. In 2001 crisis, it took twenty five months. In other words, we lost two years in terms of industrial production during both of the mentioned crisis.
In the graph for the global crisis, there are two highlighted areas. The wider one shows the period from March 2008 where industrial production peaked to the end of 2009. The other narrow area indicates when the last time the current level of production was achieved was.
In this context, we can reach two conclusions regarding the damage the global crisis made on the industrial production. First, though two years passed from the peak of production before the crisis; the current level of production is still below that peak level. Second, current level of industrial production is the same with the 2006 August-September level. That is, we can only maintain the performance of three years ago.
There is no doubt that these figures do not tell us when the industrial production will achieve the pre-crisis peak level and at which rate then it will grow. After this point on, the industrial production will mainly be shaped by global developments. First, in order for Turkey's exports to increase and make a bigger contribution to domestic production, EU countries must recover. Second, the global financial system must not be shaken once more. Currently we cannot make any conclusion on how much risk the latest developments in Greece, Portugal, and Spain pose in this regard. But it is evident that there exists a certain level of risk. We can discuss this in a separate commentary.

Graph 1: Industrial production in 1994 crisis (1993-1996)

Graph 2: Industrial production in 2001 crisis (2000-2003)

Graph 3: Industrial production in the global crisis (2005-2009)
This commentary was published in Radikal daily on 11.02.2010


